 Proem
Proem
Last March 5, 2016 the Pulse Asia published the results of their political poll survey conducted from Feb. 15 to Feb. 20, 2016. The number of samples taken was 1,800 with a margin of error of ±2%.
The results for the Presidential survey were: Poe = 26%, Binay = 25%, Duterte = 21%, Roxas = 21% and Santiago = 3%. At first glance it would seem that Senator Poe is leading in the vote preference of the Filipinos.
As a structural and earthquake engineer I have already studied and taught enough higher mathematics, probability and statistics, and sampling theories. I have also conducted political poll surveys since 1978 that it has become my habit not to accept poll surveys at face value.
Sampling theories said that the results must be comprehensive, accurate, relevant, reliable and valid. In order to know these criteria you must know how the survey was conducted and the interpretation should be in accordance to the procedure used.
Example Survey
You are asked to survey who, between Pedro and Juan, will win in the District of Cogon and Cabawan in Tagbilaran City. Cogon District has a voting population of 9,000 while Cabawan has 900 or a total of 9,900 voters.
In order to be comprehensive you took 1,000 samples. The result indicated that Pedro obtained 30% and Juan obtained 70% of the votes.
At face value you will say that Pedro will obtain 0.30 x 9,900 = 2,970 votes and Juan will obtain 0.70 x 9,900 = 6,930 votes. So Juan will win. Is it really correct?
Let us investigate the sampling procedure. It was discovered that the 1,000 samples were divided into two. Five hundred (500) samples were taken from Cogon and 500 samples were taken from Cabawan. There were actually two (2) samplings taken; one for Cogon and another for Cabawan.
In the 500 samples taken from Cogon, 275 or 55% favored Pedro while 225 or 45% favored Juan. In the 500 samples taken from Cabawan, 25 or 5% favored Pedro and 475 or 95% favored Juan.
Now let us compute according to the voters per district. In Cogon Pedro will obtained .55 x 9000 = 4,950 votes while Juan will obtain 0.45 x 9000 = 4,050 votes.
In Cabawan Pedro will obtain 0.05 x 900 = 45 votes while Juan will obtain 0.95 x 900 = 855 votes.
Now let us sum up the votes: Pedro = 4,950 + 45 = 4,995 votes. Juan = 4,050 + 855 = 4,905 votes.
Now you will notice that instead of losing by 3,960 votes (6,930-2,970), Pedro will probably win over Juan by 90 votes! Why is this so?
Analysis
There were actually two sampling areas at 500 samples each. In Cogon Pedro had 275 samples and Juan had 225 samples. In Cabawan, Pedro had 25 samples and Juan had 475 samples.
Now instead of computing separately, the samples were lumped together and considered as one sampling survey. It was then presented as Pedro = 275 + 25 = 300 samples or 30% of the 1,000 samples. Juan’s samples were added as 225 + 475 = 700 samples or 70% of the 1,000 samples.
The presentation of Pedro = 30% and Juan = 70% Â was actually an invalid presentation and will lead you to conclude that Pedro will lost by a wide margin.
If you want to consider Cogon and Cabawan as one sampling survey, the samples should have been distributed proportionately. Cogon with 9,000 votes should have 900 samples and Cabawan should have 100 samples because Cabawan with only 900 voters is only 10% compared to Cogon’s 9,000 voters.
Pulse Asia Survey
In a pure random sampling the 1,800 samples taken is already accurate for the whole Philippines. At a confidence level of 95% the margin of error will be ±2%.
In a pure random sampling the samples must be individually picked at random throughout the Philippines. It will be very expensive due to transportation cost.
What the Pulse Asia and the Social Weather Station (SWS) will do is to divide the Philippine into four (4) geographical areas, namely: National Capital Region (NCR), Luzon, Visayas, and Mindanao. They will then divide 1,800 into four and hire local pollsters to obtain 450 samples in their geographical area.
The four (4) area results will be then consolidated and considered as one survey for the whole Philippines. The situation is similar to our example for the Cogon and Cabawan survey. It tends to be invalid.
However it will be valid if the four (4) geographical areas are so selected that they will include equal number of voters. Fortunately it can be done for the whole Philippines.
Since the four areas are equal you can then compute the statistics per area and then add the results for the whole Philippines. There will be no distortion of results because the populations and the samples are equal.
Balanced Reckoning
There are 54,363,329 registered voters for the May 9 election in the Philippines. For simplicity, we will say that 46,000,000 or 84.62% will vote.
We divide 46 million into 4 geographical areas and we will have 11.5M per area to be surveyed by 450 samples. The accuracy is still ±4.5% per area and it is still good enough.
The Metro Manila area has only 6,253,249 registered voters. However we can include the surrounding areas to obtain 11.5 million voters and call it the NCR. The expansion of Metro Manila will lessen the Luzon population and all the four geographical areas will more or less balance.
Here is the tabulated result of the balanced computation:
Balance Population = 11.5M and Balanced N=450
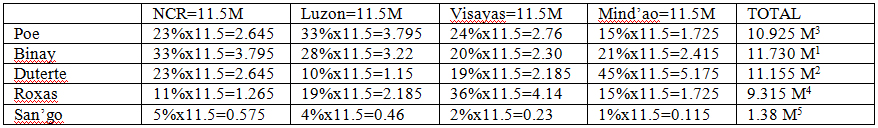
The result of the balanced reckoning in evaluating the poll survey indicates that Vice President Binay with 11.730 million votes is number one or the leading contender for the Presidency. He is followed by Mayor Duterte with 11.155 million and third is Senator Poe with 10.925 million votes and fourth is Sec. Roxas at 9.315 million votes and fifth is Senator Santiago with 1.38 million votes.
The differences are of course small that it is still within the margin of error of the survey. It is said that there is a statistical tie between the four leading candidates. It is true, but that is not the point in this presentation. The point is the manner of evaluating the survey results.
Unbalanced Reckoning
If we will use the unbalanced population of the geographical areas, the result will be different using the balanced samples of 450 per area.
If we assume that only 84.62% will vote, the distribution will be NCR=5,291,499 voters, Luzon = 19,102,709 voters, Visayas = 10,921,157 voters, and Mindanao = 10,686,844 voters
The tabulation of the results is herewith given:
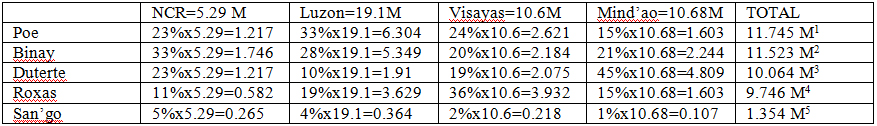
The result of the unbalance reckoning will be Poe, Binay, Duterte, Roxas and Santiago in the order of probability.
Take note that there is a big distortion between the NCR and Luzon voting population. NCR with 5.29 million voting populations and Luzon with 19.1 million voting population have equal samples of 450.
Just like our example sampling for Cogon and Cabawan with equal 500 samples, the result will be different if we add the two 500 samples directly, with that of considering them separately.
However, if we consider an equal population to be surveyed with equal size samples, the distortion will be eliminated and the regional results can be added together to represent the whole country.
Therefore in my opinion the equal population with equal sample will be a better evaluation and the result of the Pulse Asia survey published on March 5, 2016 should be evaluated as 1st-Binay; 2nd-Duterte; 3rd-Poe; 4th-Roxas; 5th-Santiago. (By Jes B. Tirol)